Examining the relationship between salary and age on a player’s performance in the MLB.
Collaborator: Owen Schaff
Examining the relationship between salary and age on a player’s performance in the MLB.
Collaborator: Owen Schaff
In this project we looked at many graphs that compared a player's age, salary, and WAR. WAR, or wins above replacement, measures all aspects of a player's game to figure out how many wins they are worth more than a replacement level player at the same position. This statistic allows us to look at both pitchers and batters and compare their value, which cannot be done through regular metrics.
Analysis of salary and performance is important because teams could save millions of dollars on players and decide if a player is worth a large contract. This would also make player acquisition more fair because smaller teams could still get valuable players, since a player's value won’t be over inflated by a bidding war for contracts. If our analysis proves that these long-term high-average-value contracts are fiscally effective, there might be shorter contracts in the future of MLB. This would ensure that players aren’t paid these 10-year, multi-million dollar contracts when they will only be worth it for their prime years. On the contrary, for players that are being underpaid yet proved valuable with their WAR vs salary statistic, they could use this data to help them receive bigger contracts.

This dataset is only for the 2015 season, and contains player name, team, games played, age, and total WAR for the season. This dataset gives us access to age and WAR, which when combined with the salary dataset, lets us compare and contrast for a season. This list also only contains qualified hitters and pitchers, which means they had to have 3.1 plate appearances per total games played by the team, or one inning per team game played. MLB player dataset
This dataset contains the year, team ID, player ID, and salary. Salary dataset
This dataset allowed us to combine both the salary and the WAR dataset. Master dataset
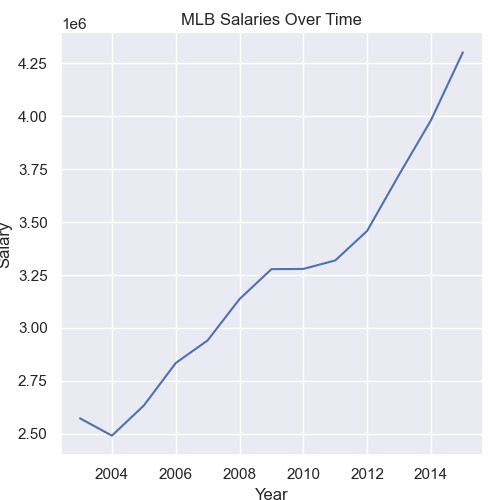
Our goal is to see how much salary plays a role in performance and how this varies by age. From 2003 to 2015 we can see that there is a positive linear pattern in salaries in the league. The average salary for a player in the league in 2004 was 2.5 million, and in 2015 the average salary for a player in the league was 4.25 million. That is a change of 1.75 million in about 11 years. So we can conclude that salaries have, on average, increased over time in the MLB.
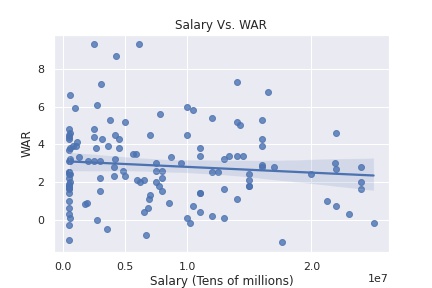
We found that the WAR and Salary don’t have a strong linear relationship, if anything, there is a slight negative relationship between salary and WAR. As salary increases, we found that WAR actually decreases a small amount. This means that even if teams sign these new “high-value” players to a large contract, there is no guarantee that they are going to produce positive results and therefore it may not be worth it to pay players such a large sum. Especially at the end of their career. As we see in the next graph, salary tends to increase with age despite the fact that WAR also decreases with age. This is because teams will sign older players, longer contracts with consistently high salaries in order to respect loyalty and the amount of time a player has dedicated to the league. But it is not worth it to pay these older players larger sums when they are producing worse results than younger players who are getting paid less. It would make the most sense to pay younger players more, when they are in their prime.
We observed that a 36 year-old in the league would be paid on average, 1.75 million whereas players less than 26 make less than one million a year, often 500,000. Even though the average WAR of a 26 year-old is larger than the average WAR of a 36 year-old.
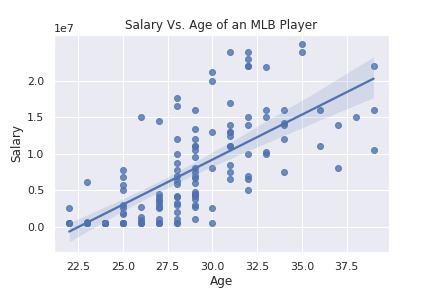
We graphed the Salary vs age of a MLB player during the 2015 season(salary in tens of millions). As it can be seen in the graph, there is a strong correlation between age and salary. This was expected, because if players entering the league make the league minimum, the salary would have to go up for those players as they continue playing baseball. However, on the graph you can see that the average 25 year old in the MLB makes around 3 million dollars, while the average 30 year old makes 9. That is a 300% increase and shows some serious wage inequalities within the sport. For this to be cost effective, players would have to increase their impact by threefold.
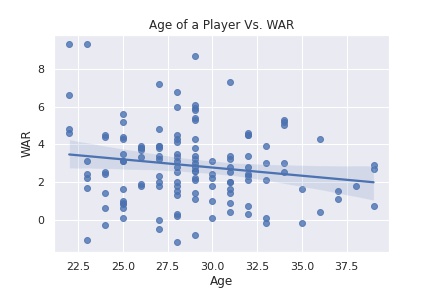
We also looked at the comparison of age and WAR. Out of all qualified players in the 2015 season, we found that there is a slightly negative, if not no correlation, between age and WAR. This is very interesting, because players are supposed to be performing better, not worse, when they get contracts/age into their “prime”. Another detail about the graph is that the two highest WAR players were 23. And while that may skew the data in favor of younger players, it really shows that players can be the best of the best when coming into the league. When you compare this graph to the salary vs age graph, you can see the outlying issue. There is a slightly negative correlation between WAR and age, but there is a very positive relationship between salary and age. This means that in most cases a contract given to a player that has a long duration will be much less valuable than one for a short period of time. The graph shows that players over the age of 36, who are making on average over 15 million a year, have about 66% of the production of a 24 year old while making almost five times as much.
Lastly, we created a machine learning model to predict WAR based on age and salary. From our code, we got a mean squared error of varying between 5 and 11 for the testing data, varying on each run of the code. This is not the greatest number, but it still confirms our original suspicions that an increase in salary does not lead to an increase in WAR. A low mean squared error on testing means that there is not enough correlation between WAR, age and salary. The data shows that paying a player more money does not mean that they will have more impact than an average starter. To make our model more accurate we could include data from more than one year to see if 2015 was an outlier year or not.
We used scikit-learn libraries to make a decision tree regression model. Our training-test data split was 80/20. Please see my Github for the code.
I am a recent graduate from the University of Washington. I studied Geographic Information Systems with a focus in Data Science. My data science passions include sports analytics (ask my about my fantasy football strategy) and Machine Learning. Outside of programming I love to hike, run ultramarathons and cook! Please reach out to me via email or LinkedIn if you have any questions.