Visualizing geolocation data from classmates' "happy places" on the University of Washington campus.
Overview
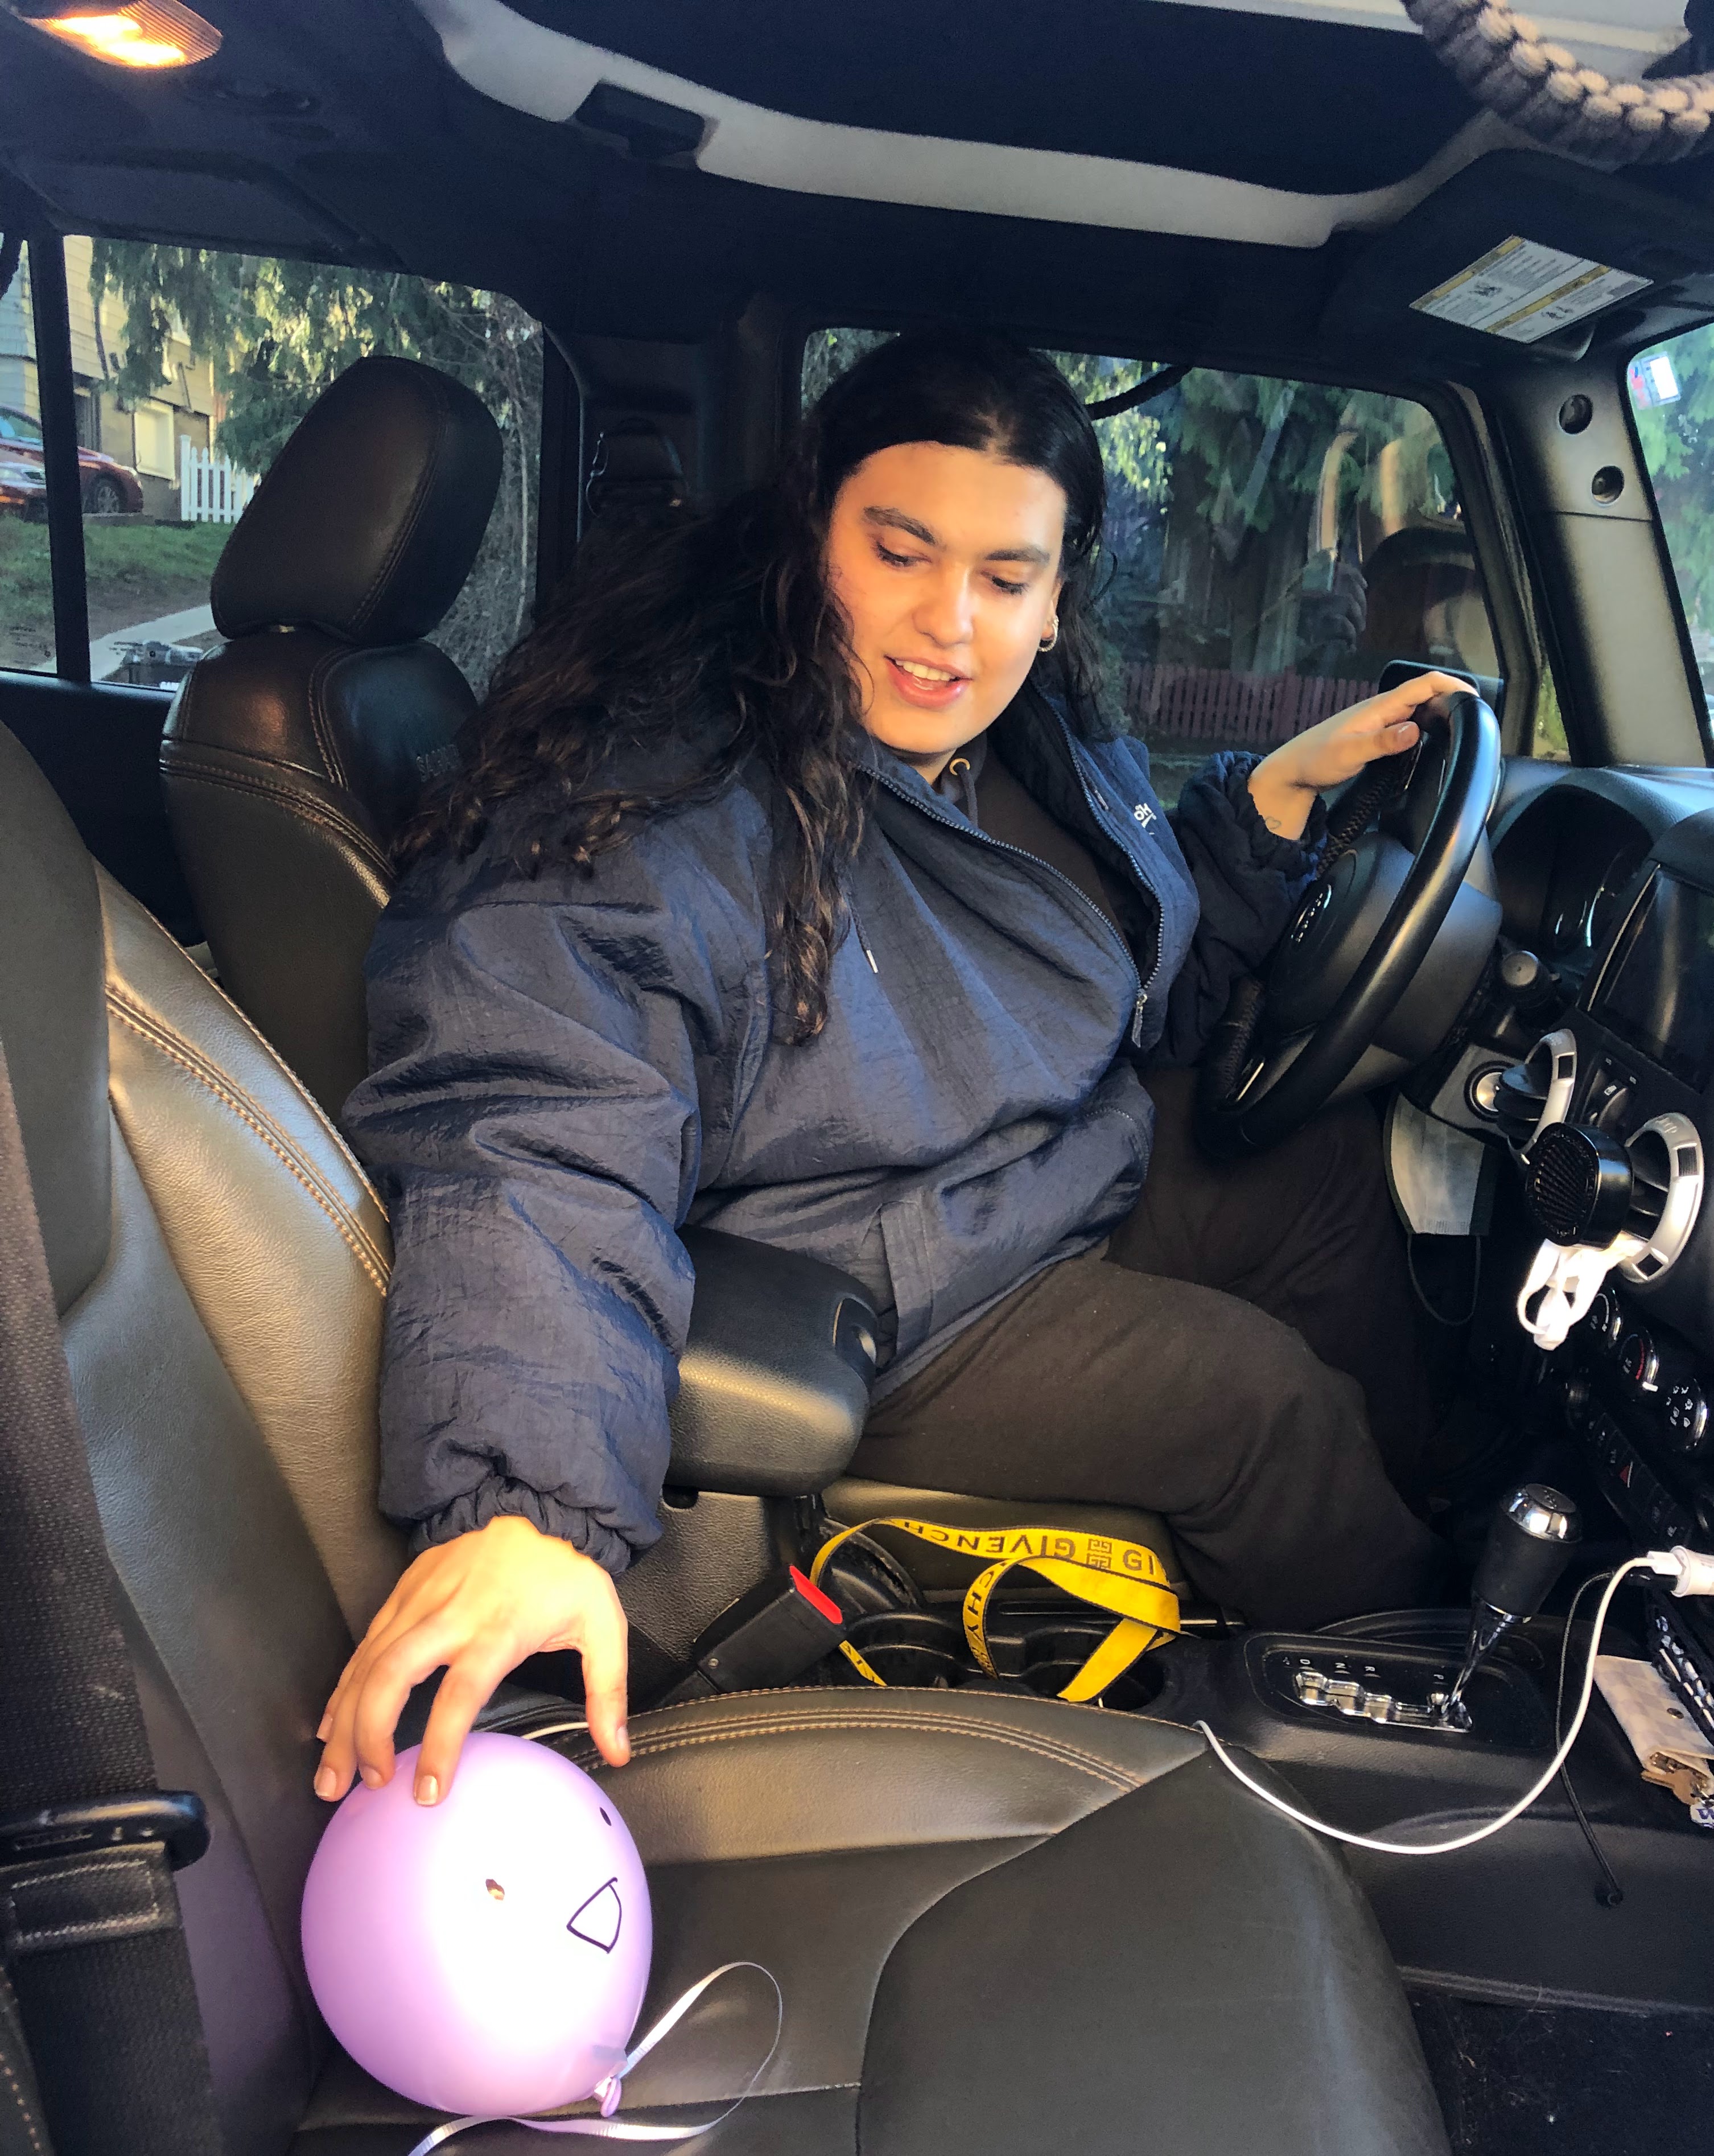
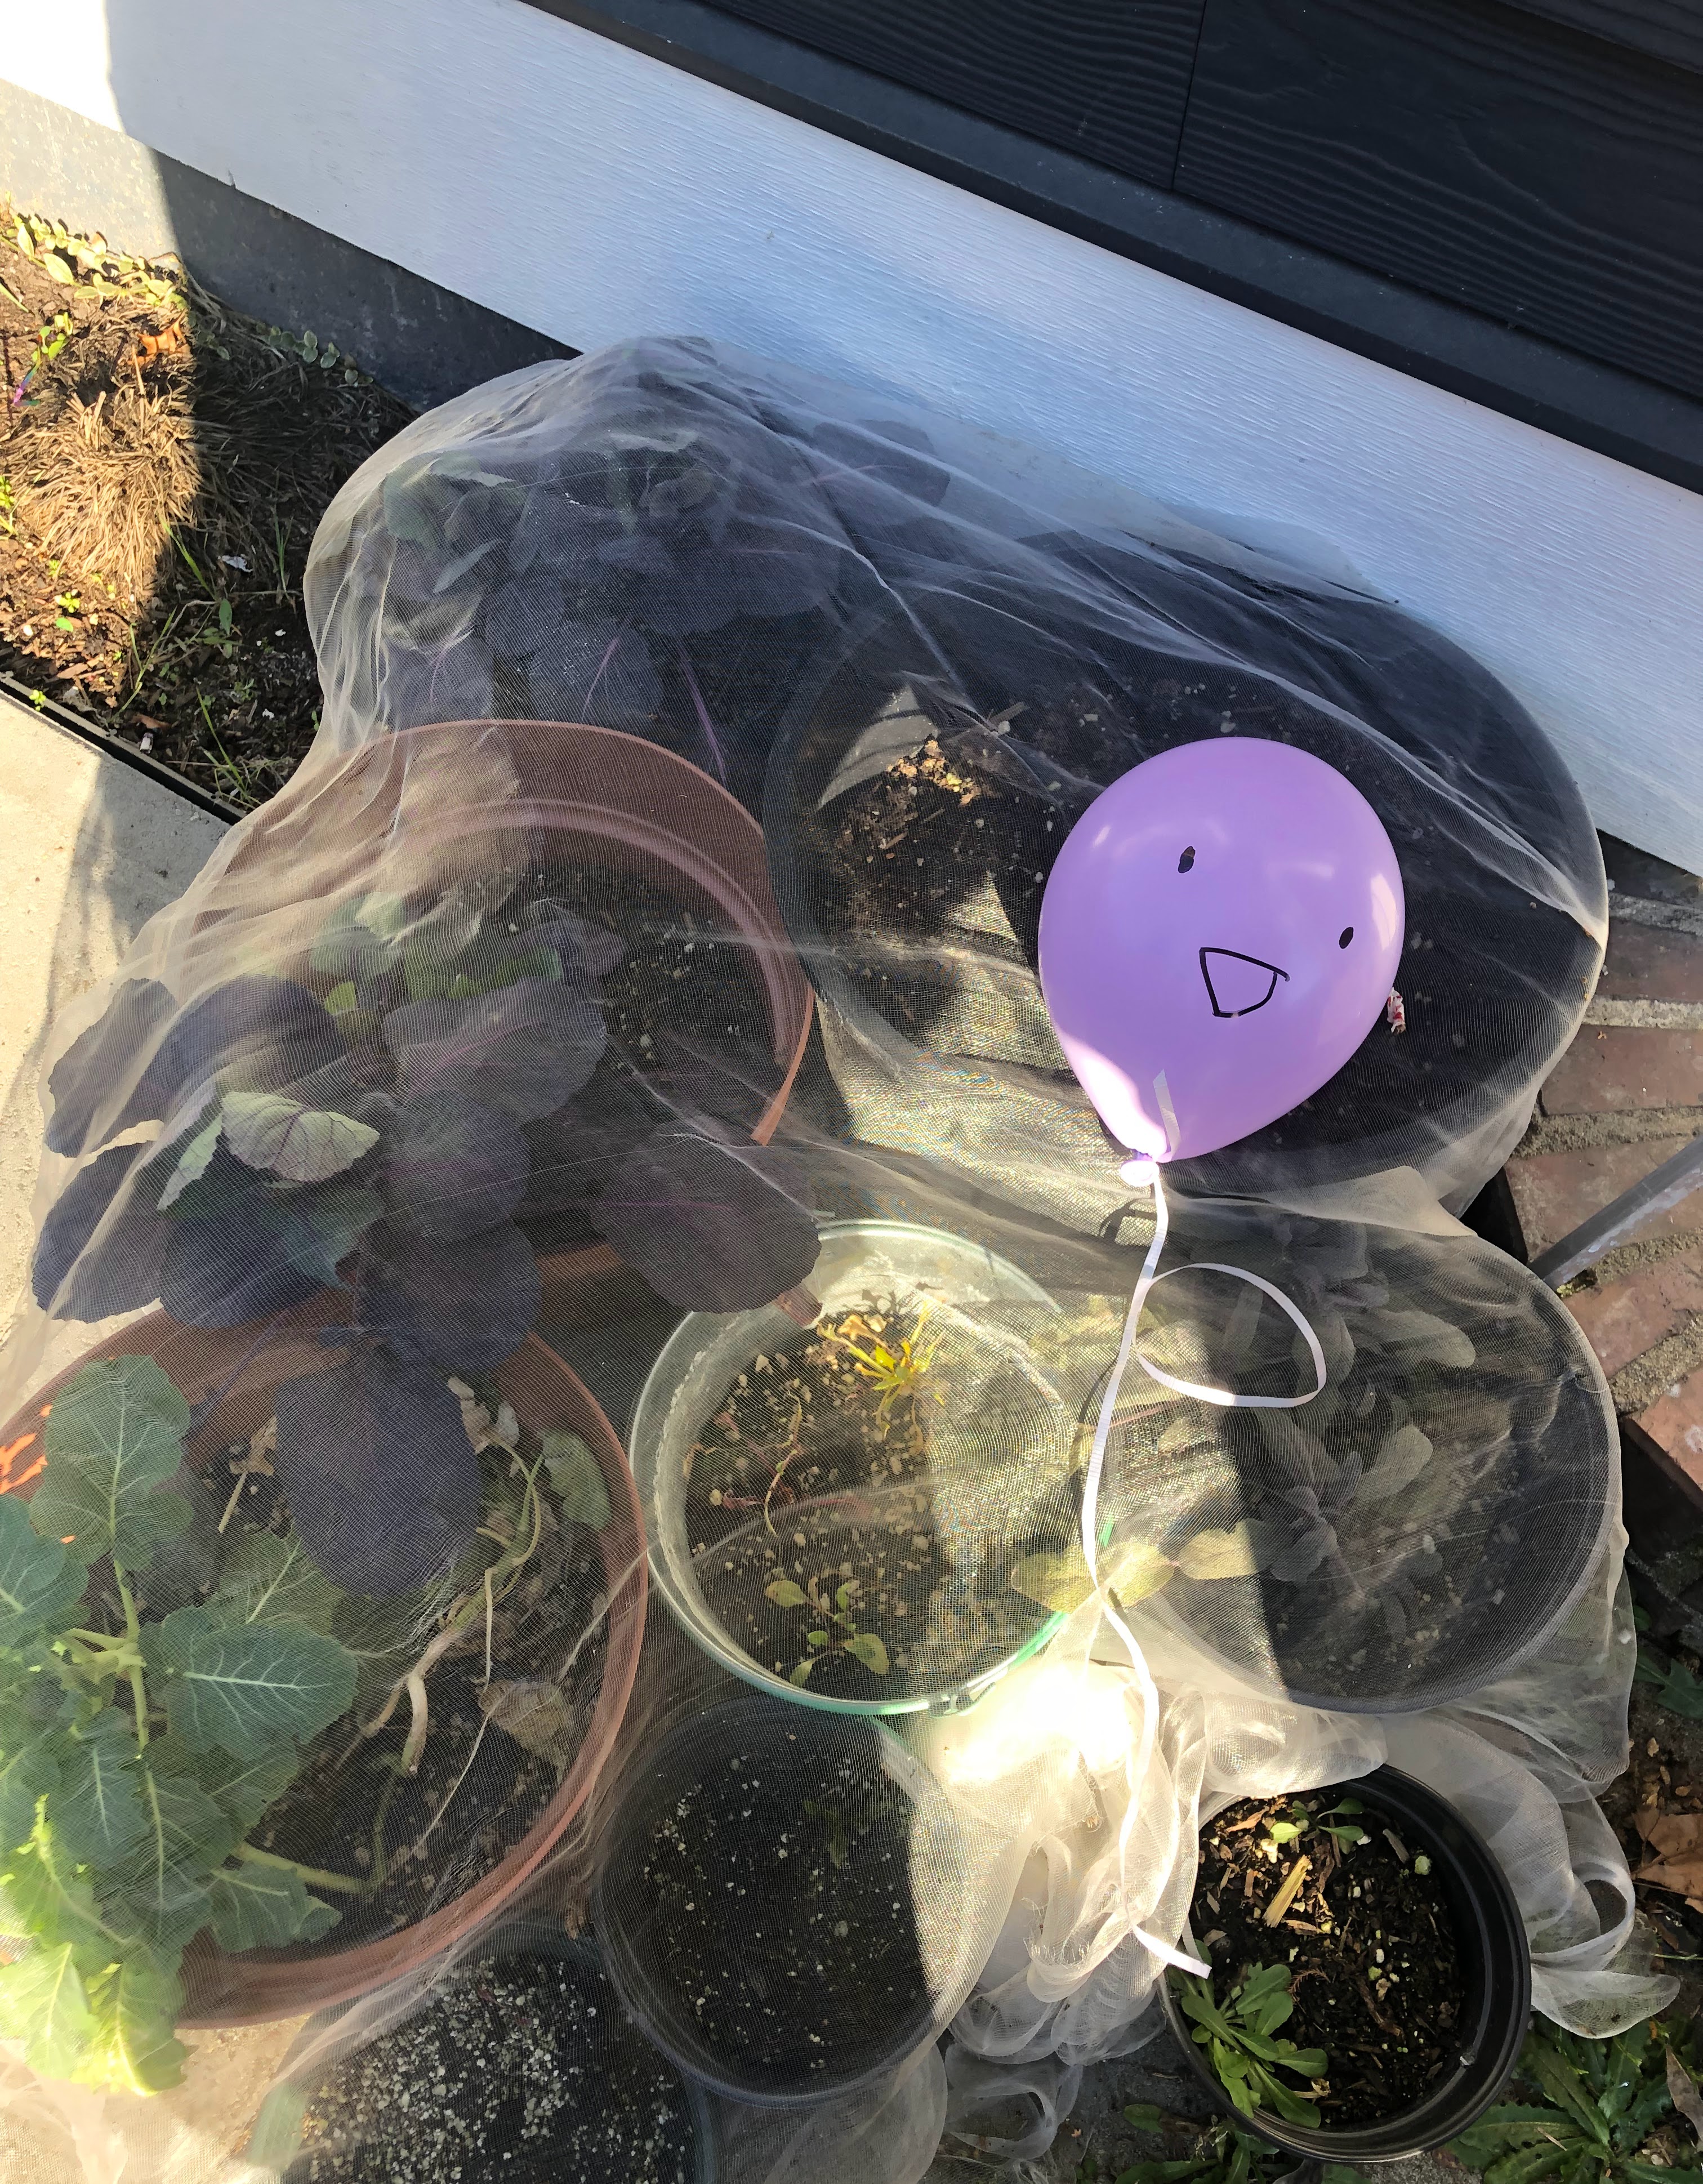
Our goal was to create an infographic that grouped geolocation data in an interesting way rather than by location similarities. Each student in one of my Python classes at UW was given a balloon with a face (see photos) and we had to take a picture of the balloon in our "happy place" and upload the name of the balloon, coordinates, photo and other data to Padlet. We decided to group the happy places to the type of location i.e. gym, shopping, etc. We used plotly to create a nested tree map. Although the code was very simple, our biggest challenge was cleaning and organizing the data with the correct parents and nodes. Each happy place had to be assigned three different classifications that all needed to nestle correctly for the visualization.

Final Visualization
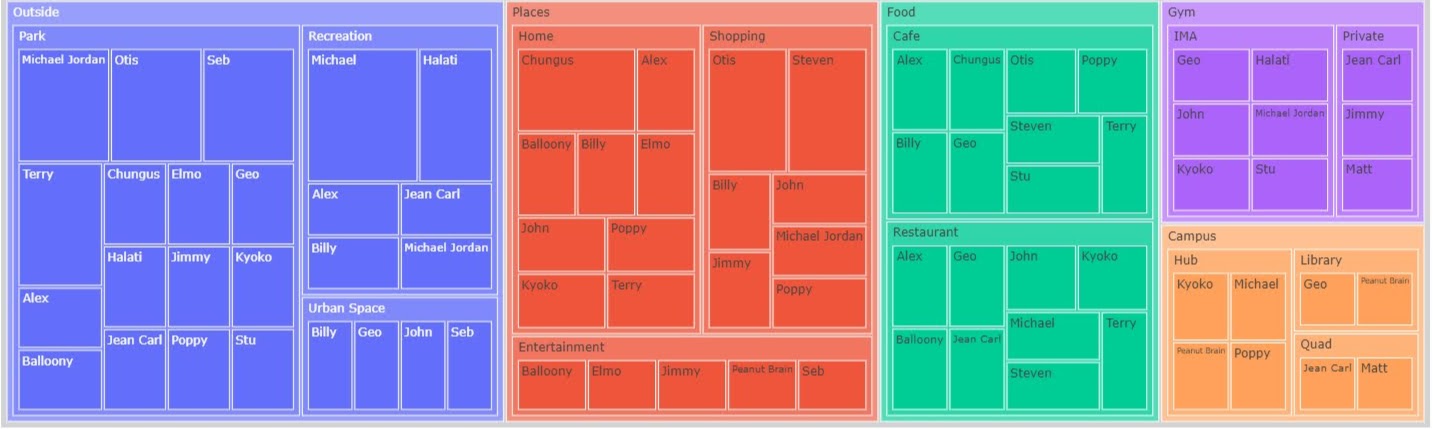
Our infographic contains the different balloons and grouped by the type of locations that they visited. The category with the most balloon visits was any outdoor space. We classified these into three groups: Park, Recreation, and Urban Spaces. Parks are green spaces usually with some sort of water feature. Frequent parks included Green Lake, and Gas Works. Recreation was any space where one or more sports was played there such as running, or canoeing. Common recreation places were Montlake Cut and Conibear Shellhouse. Urban spaces referred to a cross between nature and a shopping center or other industrial building. An example of this was apartment rooftops and University Village. Outdoors being the largest category makes sense to us because one notable characteristic about “Seattleites” is that most of them love doing outdoor recreational activities.
We have an abundance of green spaces in our city and most people care about the environment and take non-car transportation. Also many large outdoors companies started here like Brooks Running and REI. Urban green spaces are very popular, especially among the tech workers here. Young people in Seattle prefer a crossover between an urban jungle and parks as a place to live. Also, being outdoors and in nature releases endorphins which makes sense why these are most balloons’ “happy places.” Another major group was Food, Gym, and Home. There are subcategories beneath these as well except for Home. We didn’t split Home, Shopping and Entertainment into subcategories. We did this because the subcategories would be so small that they wouldn’t be significant. We differentiated between the categories using color. The “other” category (home, shopping, entertainment) is all one color.
About Me
I am a recent graduate from the University of Washington. I studied Geographic Information Systems with a focus in Data Science. My data science passions include sports analytics (ask my about my fantasy football strategy) and Machine Learning. Outside of programming I love to hike, run ultramarathons and cook! Please reach out to me via email or LinkedIn if you have any questions.